| > | restart; |
| > | f:=z->sin(z); |
| (1) |
| > | with(plots): |
| > | Re(1+I); |
| (2) |
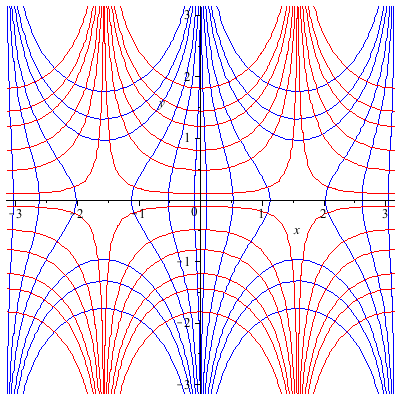
| > | P1:=contourplot(Re(f(x+I*y)),x=-Pi..Pi,y=-Pi..Pi, contours=[0.1,-0.1,.5,-.5,.9,-.9,1.5,-1.5,2,-2,3,-3], numpoints=1000,color=blue); |
| (3) |
| > | P2:=contourplot(Im(f(x+I*y)),x=-Pi..Pi,y=-Pi..Pi, contours=[0.1,-0.1,.5,-.5,.9,-.9,1.5,-1.5,2,-2,3,-3], numpoints=1000,color=red); |
| (4) |
| > | display([P1,P2]); |
 |
| > |